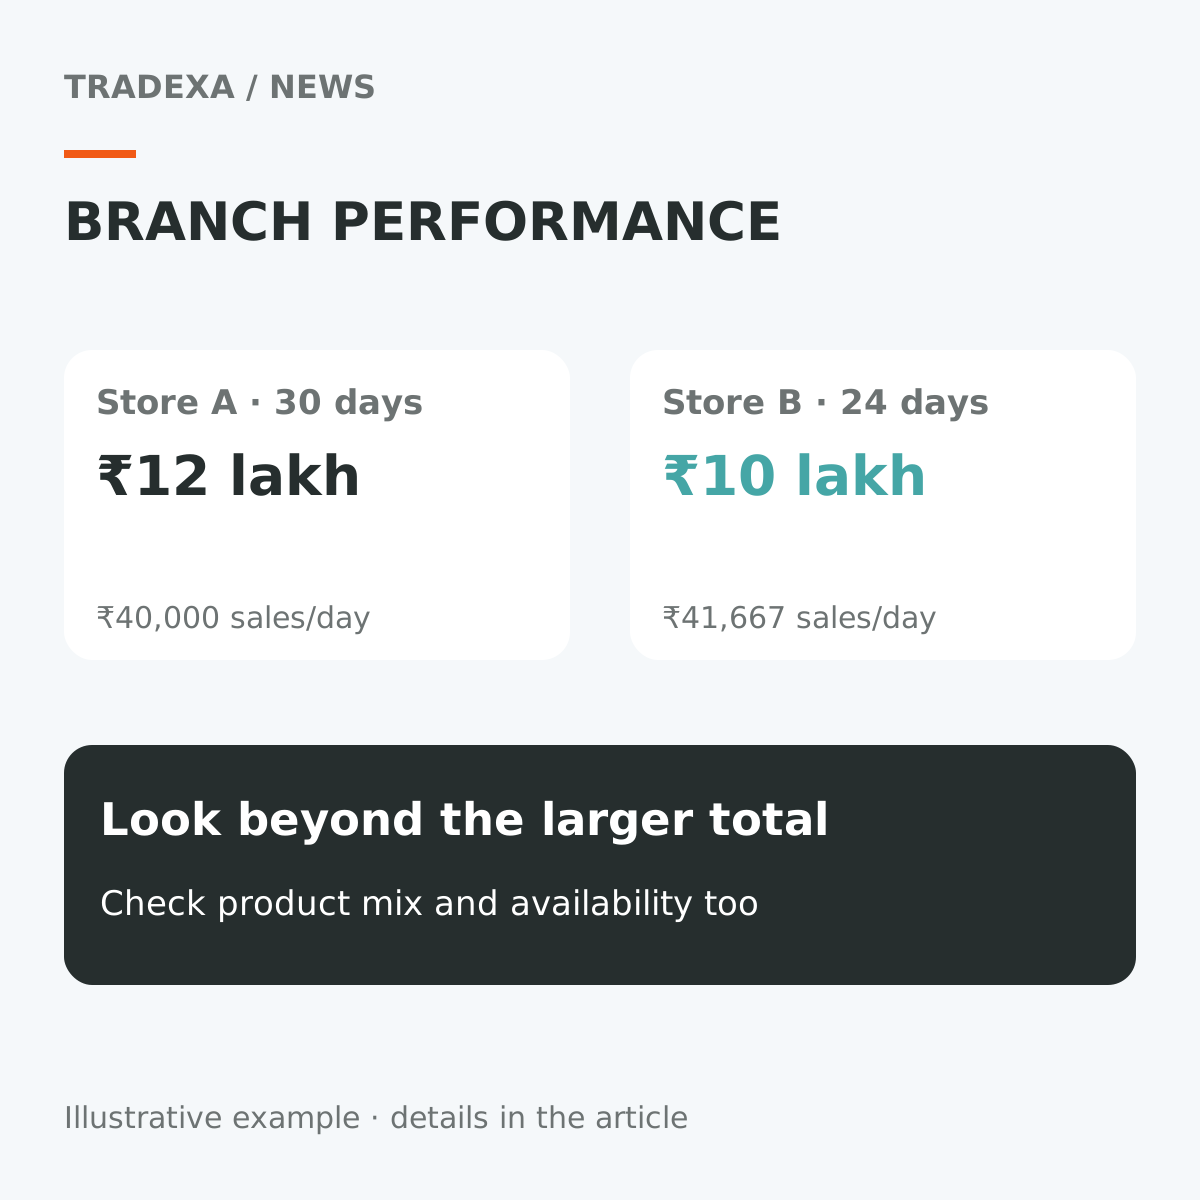
One branch sold ₹12 lakh this month. Another sold ₹10 lakh. It is tempting to call the first branch the better performer and send it more stock.
That may be the right decision, but the totals alone cannot tell you. Before rewarding one team or pressing another to improve, check whether they had comparable selling days, product ranges and stock to sell.
Did both stores have the same opportunity to sell?
In an illustrative comparison, Store A's ₹12 lakh came from 30 selling days. Store B's ₹10 lakh came from 24 because it was closed for part of the period.
A averaged ₹40,000 per selling day. B averaged roughly ₹41,667. The larger monthly total did not come from a stronger daily sales rate.
Daily sales is only one adjustment, not a complete ranking. The stores may differ in opening hours, customer traffic, maturity or local demand. Use it to investigate the decision, not to replace one oversimplified score with another.
Compare the range and availability too
A branch selling more expensive products can show higher revenue without serving more customers or keeping more contribution. Compare useful product groups rather than assuming every rupee has the same economics.
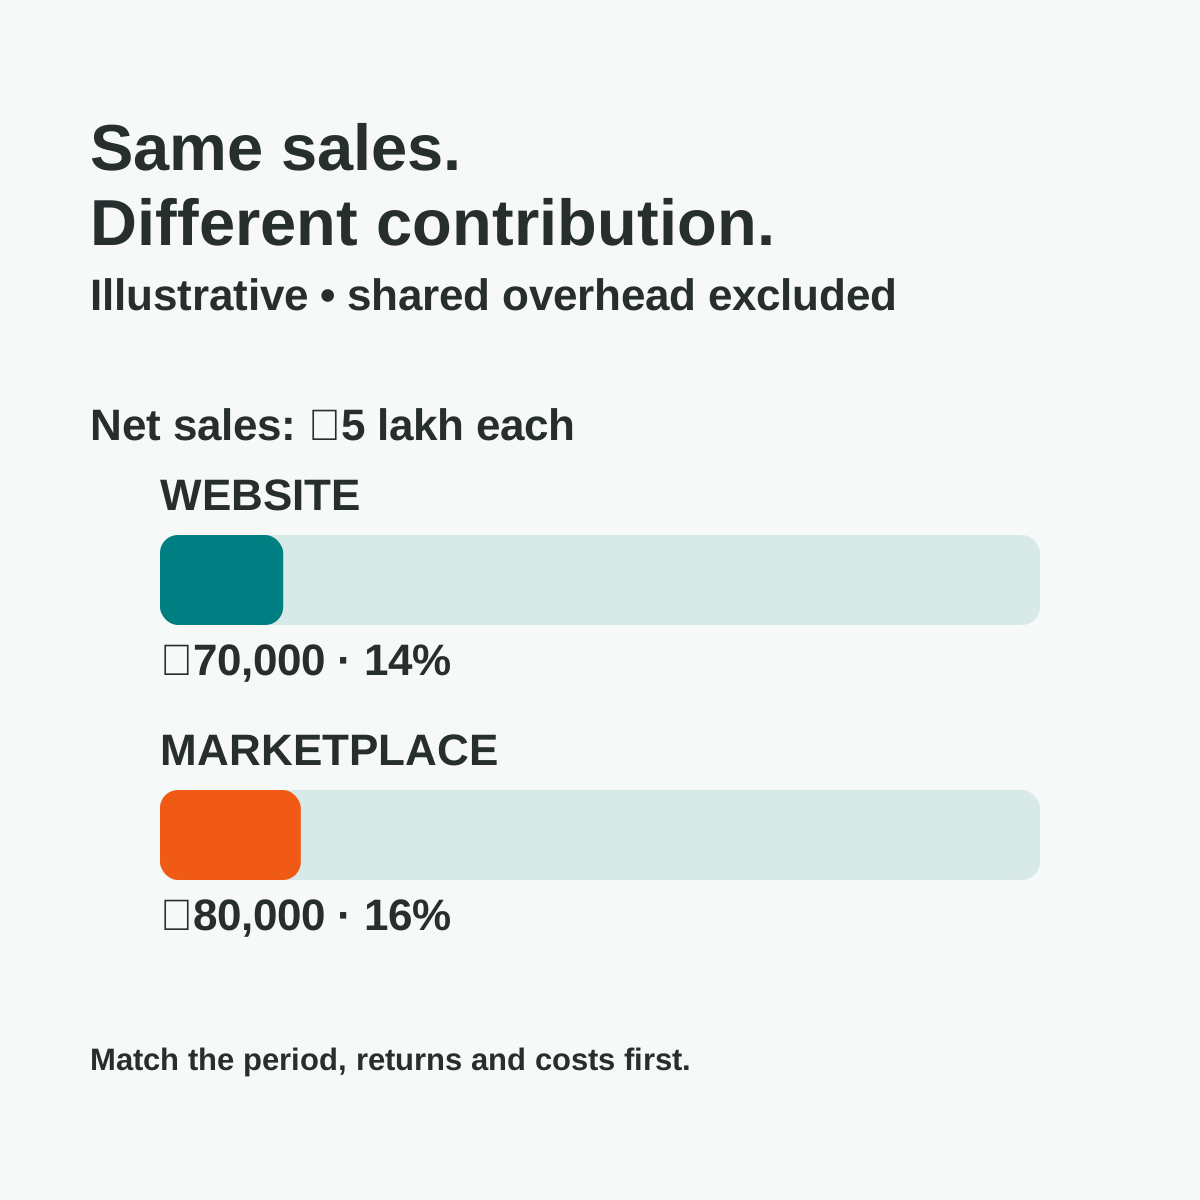
Separate returns and cancellations on a consistent basis. If one total is gross billed sales and the other is net retained sales, the comparison starts wrong.
Then examine availability. A team cannot sell a popular variant that has been unavailable for a week. Low sales may point to an assortment or replenishment problem rather than weak effort at the counter.
That changes the next action from “sell harder” to “find the product customers asked for”.
Use a branch comparison sheet, not one league table
Copy these fields for each store. Agree definitions before entering numbers so the review leads to a decision rather than an argument about whose total is right.
- Period and sales basis: dates, net sales after returns on the same tax basis, selling days and opening hours. Example: A, ₹12 lakh/30 days; B, ₹10 lakh/24 days.
- Comparable rate: ₹40,000 versus roughly ₹41,667 per selling day. Compare similar operating periods, not only monthly totals.
- Product mix: sales and units by meaningful categories, realised price and contribution where costs are available. An expensive range can lift revenue without improving margin.
- Availability: variant, days unavailable, confirmed customer requests and usable stock elsewhere. Missed requests are evidence, not assumed sales.
- Returns and exceptions: retained sales, returned units, reason and unresolved issue. Avoid comparing gross bills with net sales.
- Context: closures, promotions, store maturity or unusual local events that changed the opportunity to sell.
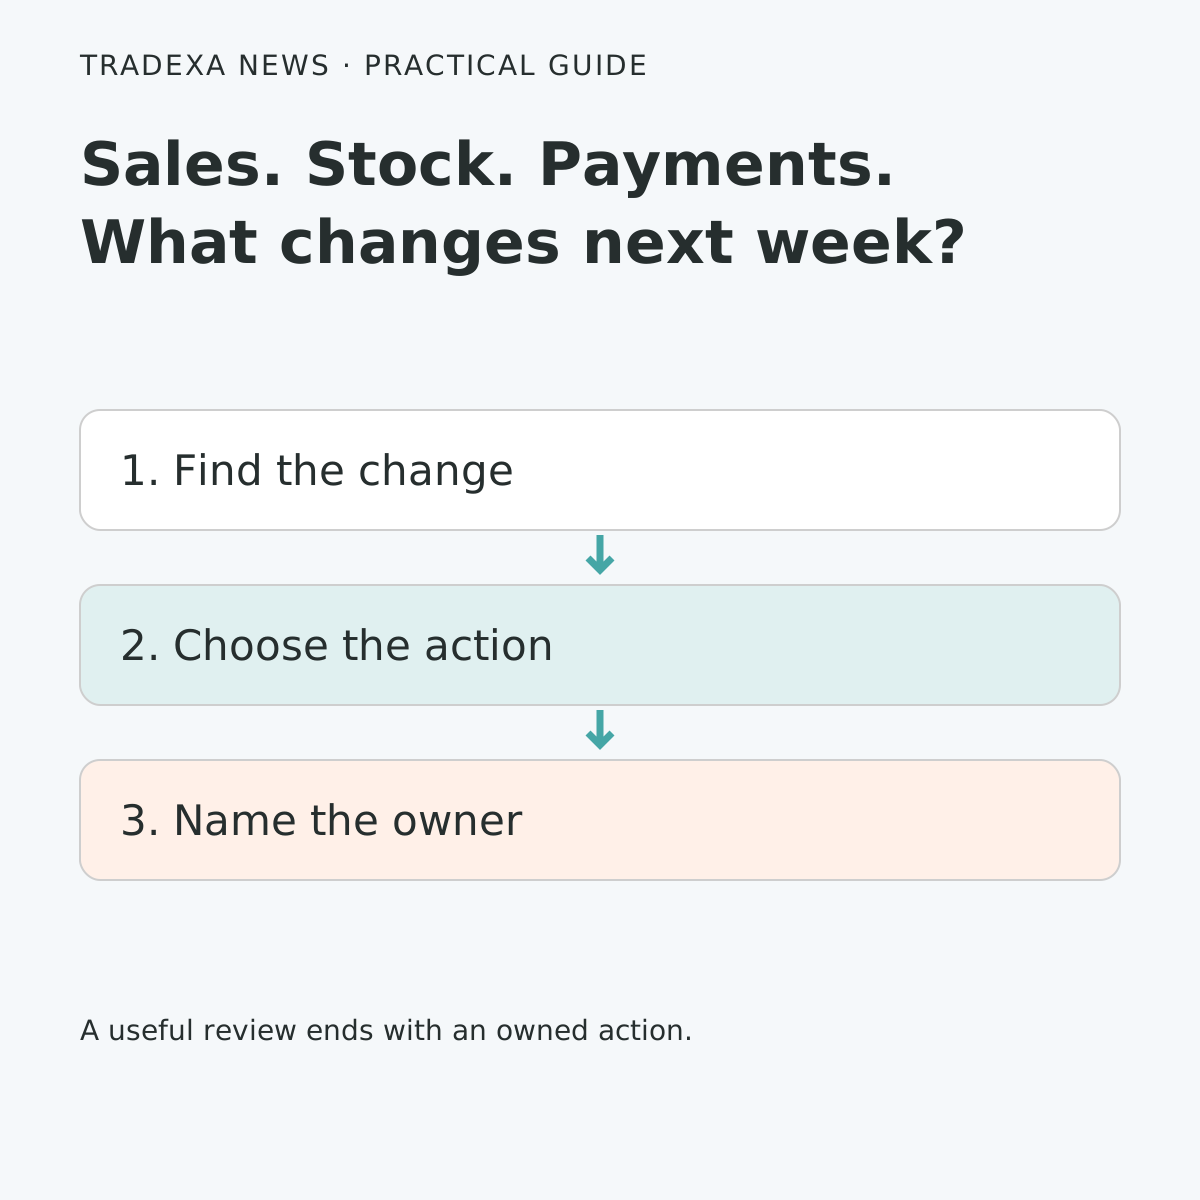
- Action: assortment change, availability repair or further investigation; owner, deadline and next review.
B's stronger daily rate does not justify sending every product there. If B has confirmed requests for a variant and A can spare it, test that transfer. If revenue comes from low-contribution promotions, review those before expanding them. If stores sell different ranges, compare matched categories before judging the teams.
Record the expected change and follow-up evidence: stock received, availability restored and sales over a defined period. That closes the loop between a report and the store's next action.
Where should the next stock allocation go?
Suppose Store B has requests for a product that Store A holds above its near-term requirement. Check demand and usable stock before moving it.
The decision is not to give every slower branch more stock. It is to send the right product where there is a supported reason to expect sales. The transfer-versus-purchase comparison explains the quantities, timing and cost checks behind that choice.
Also look for products that are not moving at either branch. Redistributing them may change the location of the problem without solving it.
Make the review useful to the people running the stores
Choose the comparison period, definitions and product groups before reviewing performance. Keep the outcome tied to an action: fix availability, investigate returns, change assortment or test an allocation.
Tradexa's reporting supports branch and warehouse views, sales and related operational records. It can help the team examine those differences without treating a revenue total as a complete profit statement.
If collecting the review takes six combined staff-hours a week and consistent records reduce gathering from three hours to one, while the other three hours remain, preparation falls to four hours. That releases two hours a week, or 104 staff-hours of preparation capacity a year at steady cadence.
Those hours can go into resolving the availability problems the review reveals. A fair comparison does more than identify a winning store: it shows where a practical change could let another store serve more customers.
Example note: The numbers illustrate a scenario, not measured customer results. Actual outcomes vary with business type, category, demand, competition, team, processes, business setup, external conditions and how effectively the workflow is used. Replace the example inputs with your own before making a decision.